
For the past ~2 months I’ve been wearing an Oura ring to analyze my sleep and steps during the day. It breaks down your sleep by stages (light, deep, rem) and gives you other metrics like heart rate, body temperature, and respiratory rate. And for a data nerd like me, I was excited to discover that Oura has an API for exporting the data so I can analyze it even further. I uploaded it to BigQuery and made use of the CORR() function (which is awesome!) to see which metrics correlated with better sleep, and also visualized some of the data in Data Studio. If you’ve got a short attentinon span, you can skip to the Recap section at the end to find out what I learned.
Disclaimer: I am not a doctor. In fact, quite the opposite - I’m a hypochondriac who likes writing Python and SQL.
Getting the data from Oura to BigQuery
I wrote a Python script to grab all of my current data from Oura’s cloud and write it to a newline-delimited JSON file (one of the file formats BigQuery accepts). Then the script uploads it to a BigQuery table. Eventually I’d like to write a script that runs every day and adds the latest data to my BigQuery dataset, but for now a one-time export suffices.
If you’re an Oura user, to run this you’ll need to grab your access token from the Oura developer console. Here’s my code for getting the data and writing it to a local file:
import requests
import json

summaries = ['sleep', 'activity', 'readiness']

for data_type in summaries:
    url = 'https://api.ouraring.com/v1/' + data_type + '?start=2019-03-21'
    access_token = 'your_oura_access_token'

    result = requests.get(url,
        headers={'Content-Type':'application/json',
                'Authorization': 'Bearer {}'.format(access_token)})
    json_data = json.loads(result.content)
    with open(data_type + '.json', 'w') as jsonfile:
        for j in json_data[i]:
            json.dump(j, jsonfile)
            jsonfile.write('\n')
Once that runs we’ll have 3 local JSON files of each data type that Oura provides: sleep, activity, and what they call “readiness,” which is something they calculate based on the quality of your sleep and activity levels.
Next, import the BigQuery client library and create a reference to your dataset:
from google.cloud import bigquery
client = bigquery.Client()
dataset_ref = client.dataset('your_dataset_name')
And we can write each file to a new BigQuery table with the following:
with open(filename, 'rb') as sourcefile:
    table_ref = dataset_ref.table(data_type)
    job_config = bigquery.LoadJobConfig()
    job_config.source_format = bigquery.SourceFormat.NEWLINE_DELIMITED_JSON
    job_config.autodetect = True

    job = client.load_table_from_file(
        sourcefile,
        table_ref,
        location="US",
        job_config=job_config
    )

    job.result()
    print('Job complete', job.output_rows)
My sleep table is now in BQ. Here’s a snapshot of what the data includes:
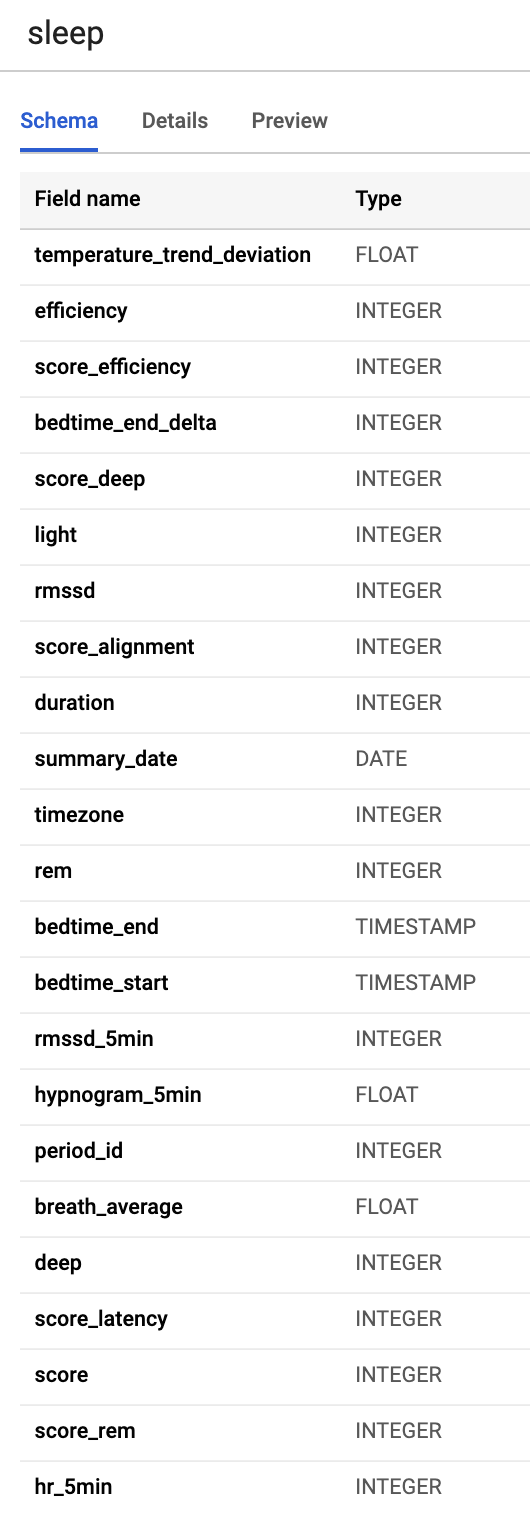
Finding correlations
Now for the fun part! I wanted to find out which factors were correlated with my overall sleep time and sleep quality (amount of rem and deep sleep). BigQuery’s CORR() function is perfect for this. It uses the Pearson correlation coefficient: you pass the function 2 values and it returns a number between -1 and 1 signaling the strength of the correlation. 0 is no correlation between the 2 values, -1 is perfectly inversely correlated (when one goes up, the other goes down) and 1 indicates perfect positive correlation.
You’ll never see values of -1 or 1 on real world data, so anything above |.5| signals a medium to strong correlation, and anything in the |.3| to |.5| range signals a small correlation.
Note that a lot of these correlations are specific to me. My friend (who is the same age) shared her Oura data with me and many of her strong correlations were different from mine. Everyone is unique!
First, which metrics had the highest positive or negative correlations in my data? Let’s see how my resting heart rate influences the % of REM sleep I get:
SELECT
  CORR(hr_average, rem / total)
FROM
  `gcp-project.bq-dataset.sleep`
This returns a correlation value of -.45, which means there’s a medium negative correlation here. This makes sense - as my heart rate increases, the % of REM I get goes down. But what influences resting heart rate? Let’s take a look at body temperature. Oura gives you data on body temperature deviation, which is the amount your current temperature differs from your average:
SELECT
  CORR(hr_average, temperature_trend_deviation)
FROM
  `gcp-project.bq-dataset.sleep`
The correlation here is .67 - very strong. The higher my body temperature, the higher my heart rate. But what about something I can more directly control, like the time I go to bed:
SELECT
  CORR(hr_average, EXTRACT(hour from bedtime_start))
FROM
  `gcp-project.bq-dataset.sleep`
This correlation is .59. So generally, the earlier I go to bed the lower my resting heart rate during the night, and the more REM I’ll get! REM sleep restores your brain and improves memory, and deep sleep helps restore your body. Unfortunately I couldn’t find any strong correlations between these factors and the % of deep sleep I got. It’s still a mystery, although I’ve read that cutting down on screen time before bed can help (ironically I read this on my phone, before bed 😬).
What about exercise?
I’m a bit of an exercise fanatic (ok, more than a bit) and since I exercise nearly every day I don’t have enough data to compare the effect of exercise vs. non-exercise days on sleep. But I did find a small correlation between the amount of activity and the % of deep sleep I get that night. This required a more complex JOIN query on the activity and sleep tables. And I needed to run DATE_SUB() in the ON clause because of the way Oura returns the data:
SELECT corr(deep / total, high + medium + low) FROM (
  SELECT high, medium, low, a.summary_date
  FROM `gcp-project.oura.activity` activity
  JOIN (
    SELECT deep, total, summary_date FROM `gcp-project.oura.sleep`
  ) sleep
  ON activity.summary_date = date_sub(sleep.summary_date, interval 1 day)
 )
This returned .32, indicating that more active days are slightly correlated with more deep sleep.
Side note on software and bias
In addition to providing a lot of interesting metrics, Oura also gives you various scores that they calculate based on these data points using their own algorithms. Each day you get a score out of 100 for your sleep, activity, and readiness. Body temperature is one of the metrics used to calculate your sleep and readiness scores. After a couple weeks of using the app I noticed a fairly strong inverse correlation between body temperature and these scores.
The problem here is that most women experience slightly elevated body temperature once a month, and it’s a normal part of being a woman. The messaging in the app is pretty clear that elevated body temperature is negative, and likely a sign that something is wrong:
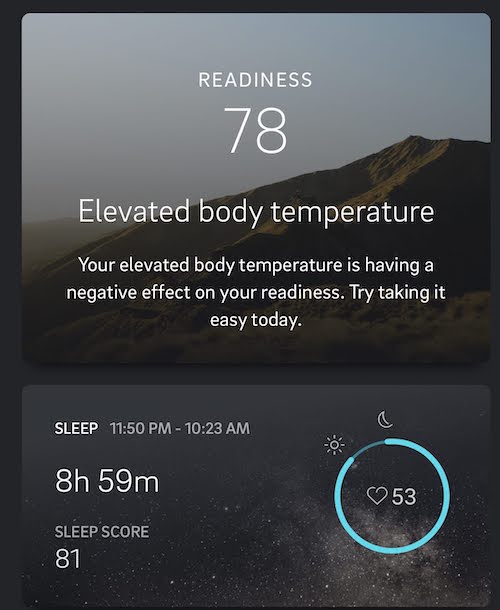
Come on, I got 9 hours of sleep!
Obviously your body temperature will also be elevated when you are sick and it may be hard to distinguish between the two, but the messaging here is a subtle example of how gender bias can creep into software. It assumes that men are the default and the way women’s bodies behave is a deviation from that default. I do hope they fix this, either by changing the algorithm to take gender and age into account or by simply changing the messaging to make it clearer that elevated body temperature isn’t always a bad thing.
That being said, I find the raw data provided by the app useful and honestly kind of addicting so I will continue to wear it 🤷🏻
Visualizing sleep data in Data Studio
Back to the fun part, let’s visualize some of this data to get a better sense of the correlations I found above. BigQuery has a great integration with Data Studio, which I can use to make some interesting time series graphs overlayed with different metrics. When I create a new Data Studio report, I just need to select BigQuery as the data source and then select Custom Query:
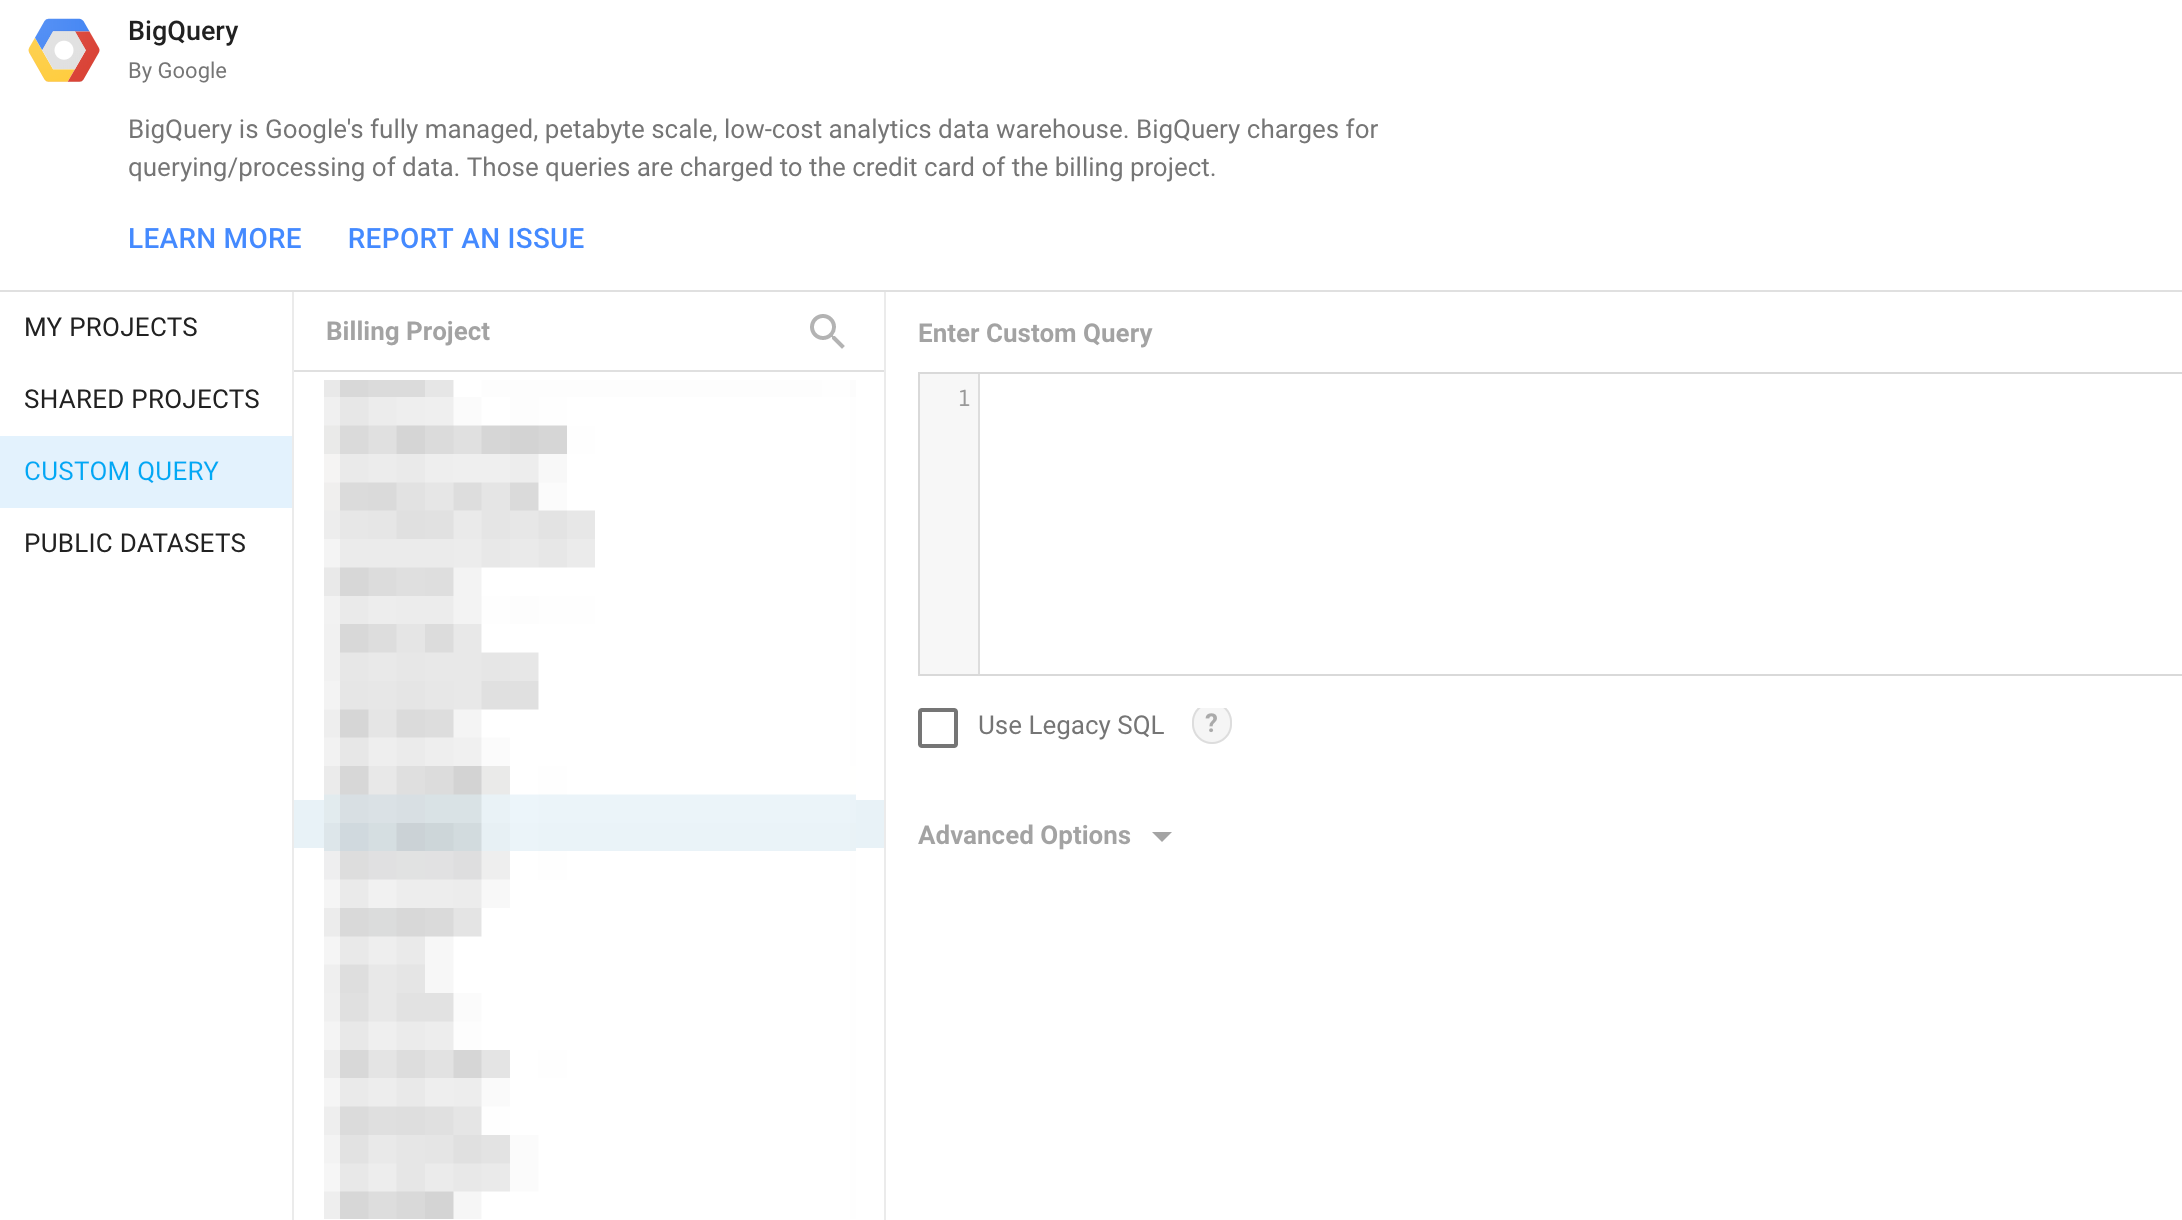
When I enter my custom query, I’ll be able to use any of the columns from that query in my charts. Since I won’t be plotting the CORR values I’ll need to make some modifications to the query above:
SELECT
    start_hr_utc, temperature_deviation, rem / total as rem_pct, deep / total as deep_pct, light / total as light_pct, low + medium + high as total_activity, steps, inactive, hr_lowest, hr_average, activity.summary_date
FROM `gcp-project.oura.activity` activity
JOIN (
  SELECT bedtime_start, extract (hour from bedtime_start) as start_hr_utc, temperature_deviation, rem, deep, light, summary_date, hr_lowest, hr_average FROM `gcp-project.oura.sleep`
) sleep
ON activity.summary_date = date_sub(sleep.summary_date, interval 1 day)
And here’s my chart for bedtime start hour vs. percentage of REM:
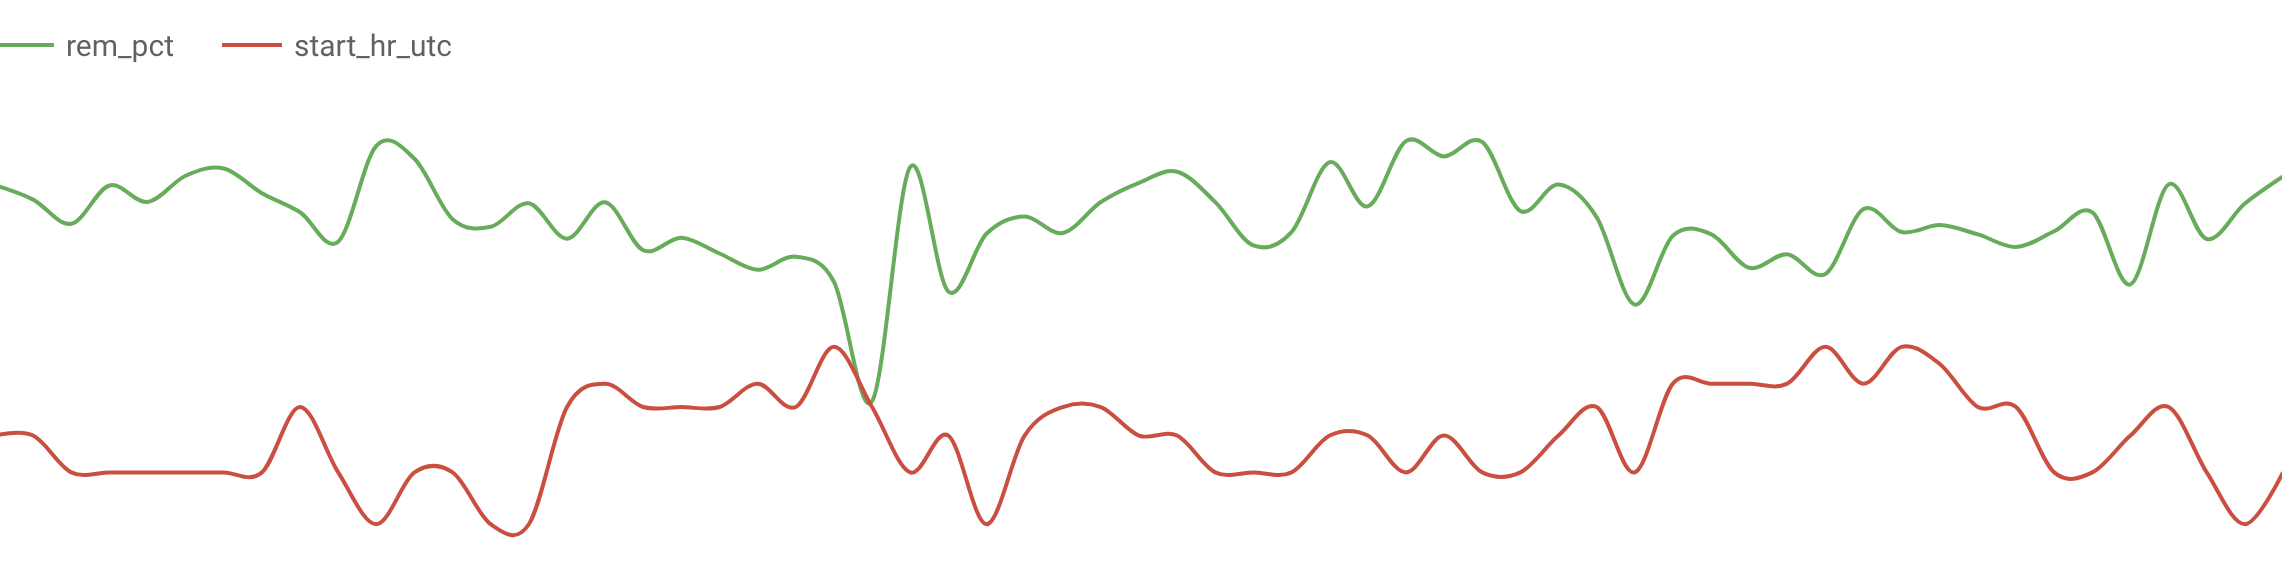
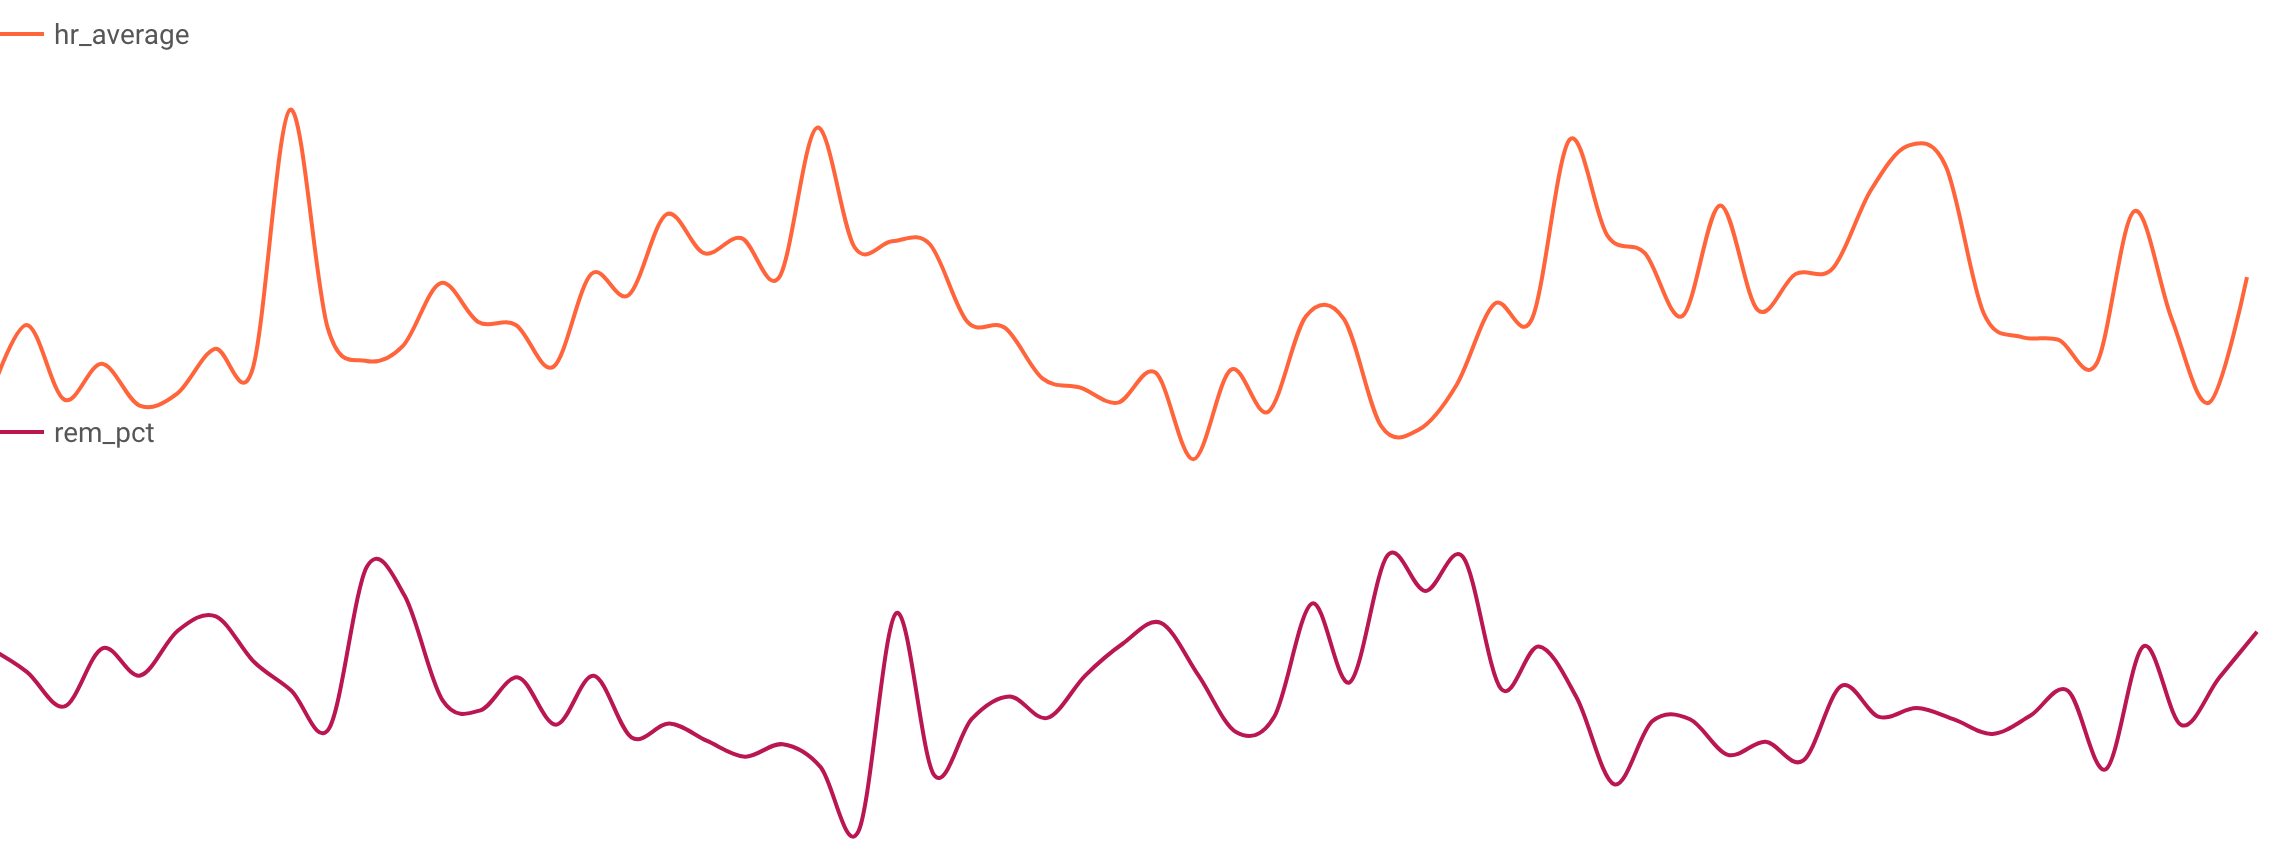
With a few exceptions, my REM percentage usually increases the earlier I go to bed. And as we can see with the next chart, heart rate and REM also have a relatively strong inverse relationship:
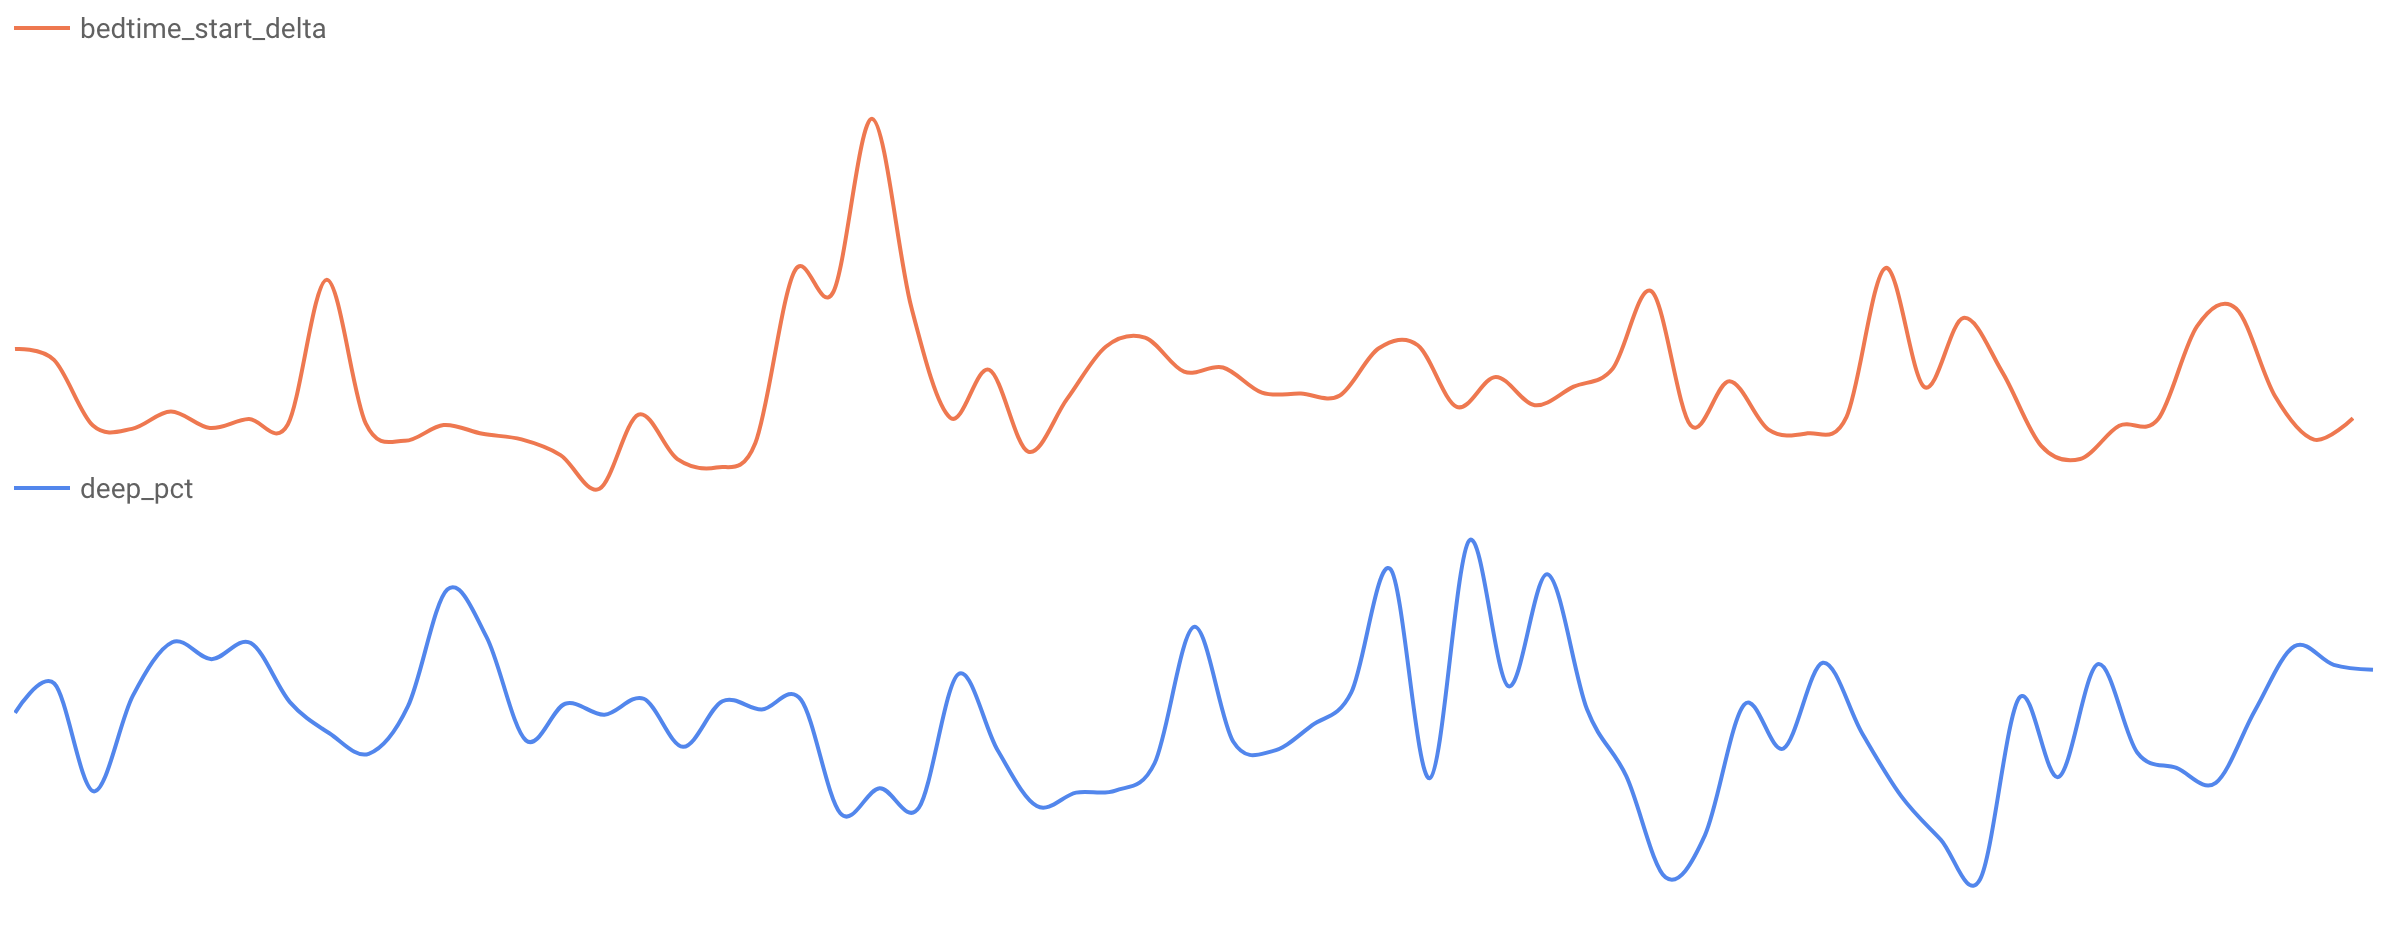
Another metric the Oura API returns is bedtime_sleep_delta. This is the difference in seconds between the current and previous night’s bedtime. I can see that drastic bedtime changes from night to night slightly decreased my percentage of deep sleep:
I’m hoping that as I continue to collect data I’ll be able to identify more correlations. I’ll keep updating this post as I find new things :)
Recap
Other than obsessively analyzing my health data, what did I learn? Here’s a recap:
- Elevated body temperature is usually correlated with elevated resting heart rate and respiratory rate
- Going to bed earlier nearly always improves REM
- Going to bed at a consistent time is also good
- Exercise for more deep sleep
- Be mindful of bias when building technology for a diverse audience 😀
Of course humans are not robots and I can’t go to bed at 9pm every night, but I still find the data useful and actionable.
What’s next?
It’ll be difficult to do machine learning on this data, since even if I collect one year’s worth I’ll still only have 365 rows in the dataset. However, I think there’s a lot of opportunity for ML with health data in general. If you know about an existing anonymzed sleep dataset, I’d love to hear about it! Find me on Twitter at @SRobTweets to let me know what you think.